What are some popular options strategies?
Options offer many possibilities to respond to movements in the stock market. Combining bought and/or sold options gives investors the opportunity to convert expectations into an options trading strategy, which can also help to limit risks.
In this article, we discuss common options trading strategies. Do you prefer to read more about what options and how they work before learning about options trading strategies? Then read this article first.
Options spreads
Before getting into some of the different options strategies, we first introduce options spreads and three common classifications of them. An options spread is an options strategy in which you buy and sell an equal amount of options with the same underlying asset, but with different expiration dates and/or strike prices. The below types of options spreads are based on the positions used relative to each other on an options chain:
These figures typically come from three distinct but interconnected reports that a publicly-traded company will release to their investors in quarterly or annual reports; the balance sheet, the income statement and the cash flow statement.
- A vertical spread involves using options with the same underlying asset and expiration date but different strike prices.
- A horizontal spread is created by using options with the same underlying asset and strike price but with different expiration dates. It is also referred to as a calendar spread or a time spread.
- A diagonal spread is a combination of vertical and horizontal spreads. This strategy is constructed using options with the same underlying asset but different strike prices and expiration dates.
Options strategies classifications
Aside from the spreads, options strategies can also be classified based on the expected market direction. Based on the outlook, strategies are categorised as bullish, bearish, neutral or volatile:
- Bullish strategies are typically used when you expect the price of the underlying stock to increase.
- If you were expecting a decrease in the underlying stock price, you may choose a bearish strategy.
- Also known as non-directional strategies, you would generally use a diagonal spread when you expect that the underlying stock will not move in price or will move within a narrow range.
- You could choose to use a diagonal spread when you believe that the underlying stock will have a large price swing but you are not sure of the direction.
Examples of some common options strategies
Below are explanations of some of the more common types of options strategies used by investors. We include examples of each so that you can get a better understanding of these concepts. Note that the examples and results given are indicative and exclude transaction costs.
Covered call
With a covered call, you sell a call option while either already owning or purchasing the underlying stock. In this case, you receive a premium from selling the call and your short position is “covered” if the buyer of the call chooses to exercise because you own the underlying shares and therefore can deliver them.
Covered calls are considered to be a neutral strategy as it is typically used when you do not believe that the price of the underlying will move much in the near future. The maximum profit with this strategy is the premium received from selling the call plus the difference between the strike price of the option and the purchase price of the underlying stocks. The maximum potential loss is equal to the purchase price of the underlying, minus the premium received.
Below is an example of a covered call:
- Buy: 100 XYZ shares £50 per share
- Sell: 1 XYZ 55 call at £2
- Net premium = £2
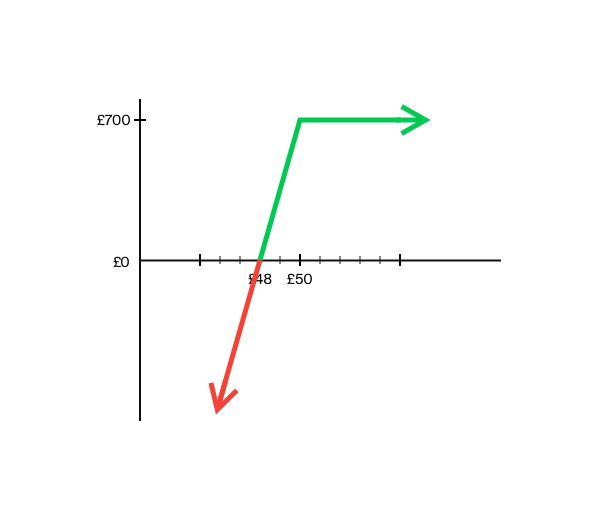
If the premium received is £2, then the break-even is £48. If the price of the underlying rises above the break-even, then you make a profit, with the maximum being £700 (£5 difference in prices, plus the £2 premium received, times the contract size of 100). Losses, in this case, are incurred if the prices fall below the break-even. They are offset by the premium received, but theoretically losses can be substantial if the price of the underlying falls.
Bull call spread
A bull call spread is a type of vertical spread strategy. As the name suggests, a bull call spread is used when you are bullish on the underlying. To exercise this strategy, you buy and sell an equal amount of call options with the same expiration date and underlying. The long call should have a lower strike price than the short call.
Both profits and losses are limited with this strategy. The potential profit is the difference between the two strike prices minus the net premium. The potential loss is the net premium.
Below is an example of a bull call spread:
- Buy: 1 XYZ 60 call at £3
- Sell: 1 XYZ 65 call at £1.50
- Net premium = £1.50 (£3 - £1.50)
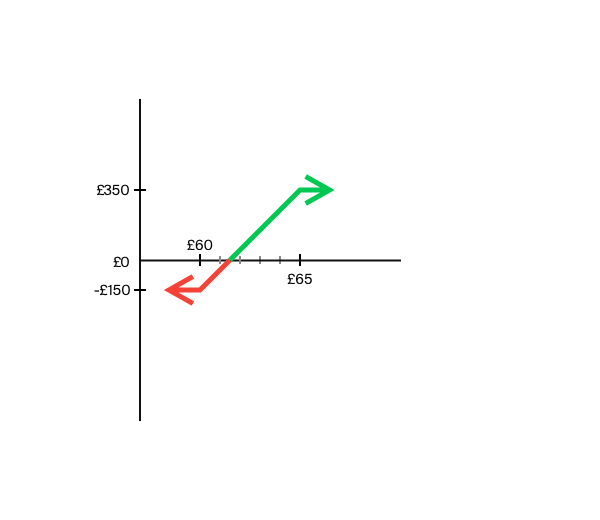
The premium paid is £1.50, therefore, the break-even is £61.50 (long call strike + net premium). If the price of the underlying rises above £65, then you make a profit with a maximum of £350 (£5 difference in prices, minus the £1.50 net premium, times the contract size of 100). Losses are incurred if the price of the underlying ends below the break-even. In this case, the maximum loss is £150.
Bear put spread
Bear put spreads are also a type of vertical spread strategy that is typically used when you are anticipating a decrease in the price of the underlying asset. This strategy involves buying and selling an equal amount of puts with the same underlying and expiration date. The put that is sold should have a lower strike price than the put purchased.
The maximum profit with a bear put spread is equal to the difference in strike prices between the puts minus the net premium paid. On the other hand, the maximum potential loss is the premium paid.
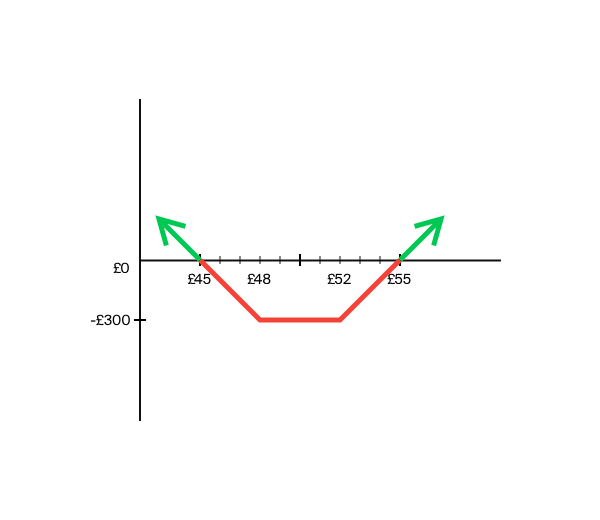
Below is an example of a bear put spread:
- Buy: 1 XYZ 60 put at £4
- Sell: 1 XYZ 55 put at £2
- Net premium = £2 (£4 - £2)
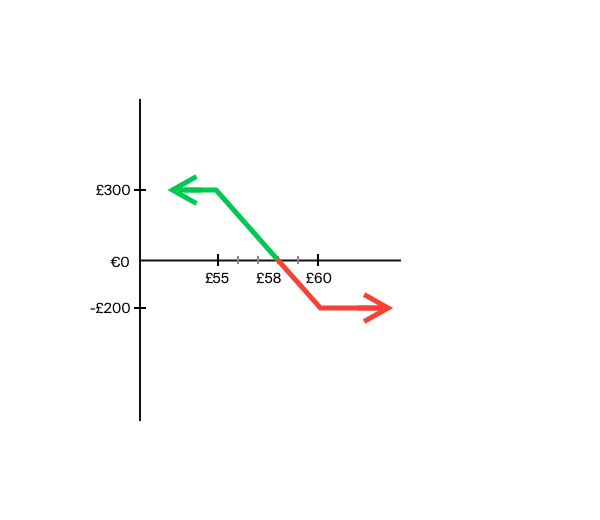
The net premium paid is £2 and therefore the break-even is £58. You profit if the underlying asset ends below the break-even. In this example, the profit is maximised to £300 (£5 difference in prices, minus the £2 net premium, times the contract size of 100). When the price of the underlying ends above £58, then you experience a loss with a maximum of £200.
Long straddle
With this strategy, you profit from significant price movements in either direction and therefore it is considered a volatile strategy. When the price remains fairly stable, you can lose money. To exercise this strategy, you buy an equal amount of calls and puts that have the same underlying stock, strike price and expiration date. The strike prices, in this case, are at-the-money.
There are two break-even points with this strategy, the strike price minus the net premium paid and the strike price plus the net premium paid. The risk of a straddle options strategy is limited to the premium paid. If the price moves both up or down, the net asset value of one of the options increases. This means that the premium paid is (partially) recouped or the investor can even make a profit with this increase. Profits can be unlimited with this strategy on the upside.
Below is an example of a long straddle:
- Buy: 1 XYZ 50 call at £3
- Buy: 1 XYZ 50 put at £1
- Net premium = £4 (£3 + £1)
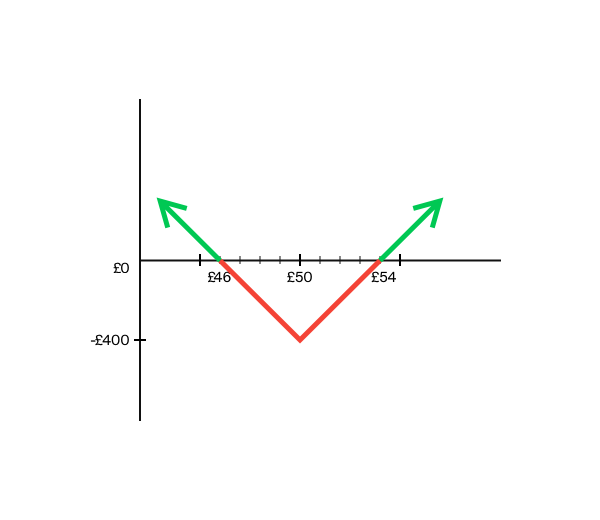
The net premium paid is £4, making the break-even prices £46 and £54. If the price of the underlying asset ends below £46 or above £54, you will make a profit. If the price of the underlying asset ends between £46 and £54, you will make a loss. This loss is maximised to £400 (£4 net premium paid times the contract size of 100).
Long strangle
With this options strategy, you benefit from significant price movements. This strategy is similar to the long straddle. The difference is that in this case, the strike prices are not equal. The strike price of the call option is higher than that of the put option and both are out of the money. The underlying asset and the expiration date are the same for both. If the stock price at expiration is equal to or between the strike prices, both contracts will expire worthless.
With a long strangle options strategy, losses are incurred when the price of the underlying ends between the break-even prices. There are two break-even prices, the higher strike price plus the net premium and the lower strike price minus the net premium. Potential losses are limited to the premium paid. Profits, on the other hand, have the potential to be unlimited.
Below is an example of a long strangle:
- Buy: 1 XYZ 52 call at £2
- Buy: 1 XYZ 48 put at £1
- Net premium = £3 (£2 + £1)
The premium paid is £3. Therefore, the break-even prices are £45 and £55. If the price of the underlying asset ends below £45 or above £55, you will make a profit. If the price of the underlying asset ends between £45 and £55, you will make a loss. This loss is maximised to £300 (£3 premium paid times the contract size of 100).
Butterfly spread
This butterfly options strategy is a combination of two vertical spreads and is considered to be a neutral strategy. It is a three-part strategy whereby you buy an option, sell two options with a higher strike price and buy an option with an even higher strike price. They all have the same underlying asset and expiration date and the strike prices are equidistant. It gets its name from the shape of the graph that is created with the combination of the options contracts.
The maximum potential profit and loss are limited. Maximum losses are limited to the net premium paid. Losses are incurred when the price of the underlying asset ends below the lowest strike price or above the highest strike price. The maximum potential profit is equal to the difference between the middle strike prices and the lowest strike price, minus the net premium paid. The maximum profit is realised when the underlying asset ends at the strike price of the short calls.
Below is an example of a long call butterfly spread:
- Buy: 1 XYZ 45 call at £5
- Sell: 2 XYZ 50 call at £2
- Buy: 1 XYZ 55 call at £1
- Net premium = £2 (£5 + £1 – (2 x £2))
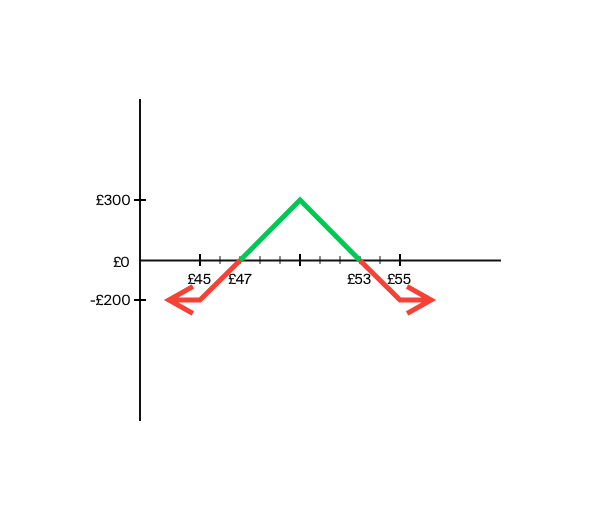
The net premium paid is £2. As a result, the break-even prices are £47 and £53 (lowest strike plus net premium and highest strike minus net premium). If the price of the underlying asset ends between £47 and £53, you make a profit. This profit is capped at £300 (middle strike price £50, minus lowest strike price £45, minus the net premium £2, times the contract size of 100). If the price of the underlying asset ends below £47 or above £53, you will make a loss. This loss is maximised to £200.
Iron condor spread
A long condor spread is a four-part strategy and is similar to a butterfly spread as it also uses two vertical spreads and it is considered a neutral strategy. The four options involved have the same expiration date and underlying asset, but all of them have different strike prices.
To construct it, you buy a put, sell a put with a higher strike price than the put purchased, sell a call with a strike price higher than the sold put and buy a call with the highest strike price of all the options involved. The call spread and the put spread are of equal width.
The maximum potential profit and loss are limited. If the price of the underlying asset ends in between the break-even points, you make a profit that is maximised to the net premium received. Compared to a butterfly spread, there are more end prices in which you can achieve maximum profit. If the price of the underlying asset ends out of the aforementioned range, you make a loss. The maximum loss received is equal to the difference in strike prices of either spread, minus the net premium received.
Below is an example of an iron condor:
- Buy: 1 XYZ 45 put at £1.50
- Sell: 1 XYZ 50 put at £2
- Sell: 1 XYZ 55 call at £2.50
- Buy: 1 XYZ 60 call at £1
- Net premium = £2 (-(£1.50+1) + (£2+£2.50))
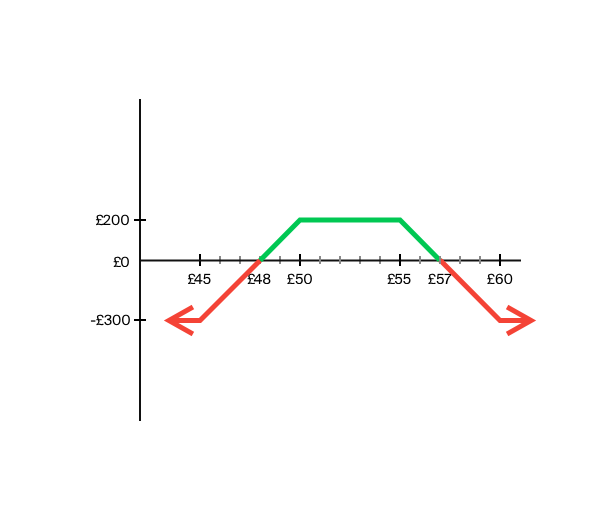
The net premium is £2. As a result, the break-even prices are £48 and £57 (strike price of short put minus the net premium and strike price of short call plus the net premium). If the price of the underlying asset ends between £48 and £57, you make a profit. This profit is capped at £200. If the price of the underlying asset ends below £48 or above £57, you will make a loss. This loss is maximised to £300 (£5 in the difference between strike prices, minus £2 premium received, times the contract size of 100).
What are the risks involved in investing in options?
Before you invest in options, it is important that you first learn what the options are, but more importantly, that you understand the risks. Options and other complex products are not intended for beginning investors and some strategies are more advanced than others.
While some of the options strategies mentioned intend to limit risk, if the strategy is not carried correctly, you run the risk of losing your entire investment or more. You should only invest in products that match your knowledge and experience and are suitable for your investment plan.
The information in this article is not written for advisory purposes, nor does it intend to recommend any investments. Investing involves risks. You can lose (a part of) your deposit. We advise you to only invest in financial products that match your knowledge and experience.
Start investing today.
Start investing today.
- Incredibly low fees.
- Comprehensive tools, capabilities, and service.
- Worldwide. Anytime and anywhere.
- Secure structure.